A teer result chart 2026 is simply a record that collects the daily outcomes of the teer lottery game into one organized view. Instead of searching for each day’s first round and second round numbers separately, a chart lines them up by date, usually across a full month, so you can see the whole record at a glance. If you have ever opened a chart and felt confused by the rows, columns and labels, this guide will teach you how to read every part of it. You will learn what FR and SR columns mean, how monthly teer result records are organized, how the Shillong teer chart differs from Juwai and Khanapara versions, and how to use a teer number chart for honest record keeping without falling into prediction myths. Charts are reference tools, not fortune tellers, and by the end of this page you will read them with confidence.
What a Teer Result Chart 2026 Actually Is
A teer chart is a calendar style record of declared results. Teer is an archery based lottery game played in Meghalaya, where archers shoot arrows at a target and the last two digits of the total arrows that hit the target become the winning number for that round. Each market holds two rounds every working day, the first round (FR) and the second round (SR). A teer result chart 2026 takes the declared number from each of those rounds and places it in a table under its date. You can read more about the background of the game on the Wikipedia page for Teer at , which explains how this traditional sport became a legal lottery format.
A chart is a record, not a live result feed
The most important thing to understand is that a chart shows history. A live result page gives you today's numbers as they are declared, while a chart stores what has already been declared so you can look back over days, weeks and months. Think of the difference like a newspaper versus an archive. If you want today's outcome, check the daily result first, and if you want to review what happened last week or last month, open the chart. For the freshest daily outcomes, our full teer result list at https://viewteerresult.today/teer-result-list/ is the right place to start, and the chart is the right place to review.
What each row and column means
Most charts are built on a simple grid. Each row stands for one calendar date, and the columns split that date into its rounds. A typical row reads from left to right as: date, FR, SR. Some charts add a separate pair of columns for morning sessions or night sessions, which we will cover later. The cell where a date row meets the FR column holds the first round result for that day, and the cell under SR holds the second round result. Once you grasp this row plus column idea, every teer chart you ever open will make sense, because they all follow the same basic pattern even when the styling looks different.
How FR and SR Rounds Show Up on the Teer Chart
The two columns you will see on almost every chart are FR and SR. FR stands for first round and SR stands for second round. In the Shillong game, the first round is declared in the afternoon and the second round follows later the same day. Other markets like Juwai and Khanapara follow a similar two round rhythm, with morning sessions adding an extra pair of rounds on some charts. Knowing which column is which matters because the two rounds are separate events with separate results, and mixing them up is one of the most common reading mistakes.

Reading the FR column
Move your eyes down the FR column to see the sequence of first round results across the days of the month. Each cell holds one two digit number (example only, not a real result). If a cell shows a dash or a blank space instead of a number, the result for that round had not been declared yet when the chart was last updated, or the game was not held that day. Sundays are a common example, since teer is generally not played on Sundays, so Sunday rows often stay empty across all columns.
Reading the SR column
The SR column works exactly the same way, but for the second round of each day. Because the second round is declared after the first, charts sometimes show the FR cell filled while the SR cell for the same date still shows a placeholder. That is normal and simply means the day’s chart is half complete. When you return after the second declaration time, the SR cell gets its number and the row is complete. A chart that shows placeholders is not broken; it is just waiting for the official declaration.
What a blank or placeholder cell means
Blank cells can mean three different things, and telling them apart is a useful skill. First, a blank can mean the result is pending, which happens between the two declaration times on the same day. Second, a blank can mean no game was held that day, as with Sundays and public holidays. Third, a blank can mean the chart itself has not been updated yet. The clue is the date: if the date is today and the FR cell is filled but SR is empty, the result is pending. If the date was a Sunday, no game was held. If several past working days are blank, the chart page may simply be out of date, and you should check a fresher source.
Understanding the Teer Result Chart 2026 Layout
Charts for 2026 follow the same conventions as charts from earlier years, so once you learn the layout you can read any year’s record. The teer result chart 2026 is usually split into twelve monthly tables, one per month from January to December, because a month is the most practical unit for browsing and printing. Each monthly table repeats the same structure: a header row naming the columns, then one row per day of that month. Some websites present all twelve months on one long page, while others give each month its own page or tab. Either way, the reading method is identical.
Daily rows and monthly grids
Within a monthly grid, dates run in order from the first of the month to the last. This ordered layout lets you scan a whole month in seconds. If you want to know how many playing days a month had, count the rows with numbers in them. If you want to compare the first week of January with the first week of February, open the two monthly tables side by side. The grid format is what makes charts so much faster than scrolling through day by day result posts, which is exactly why regular followers prefer them for record keeping.
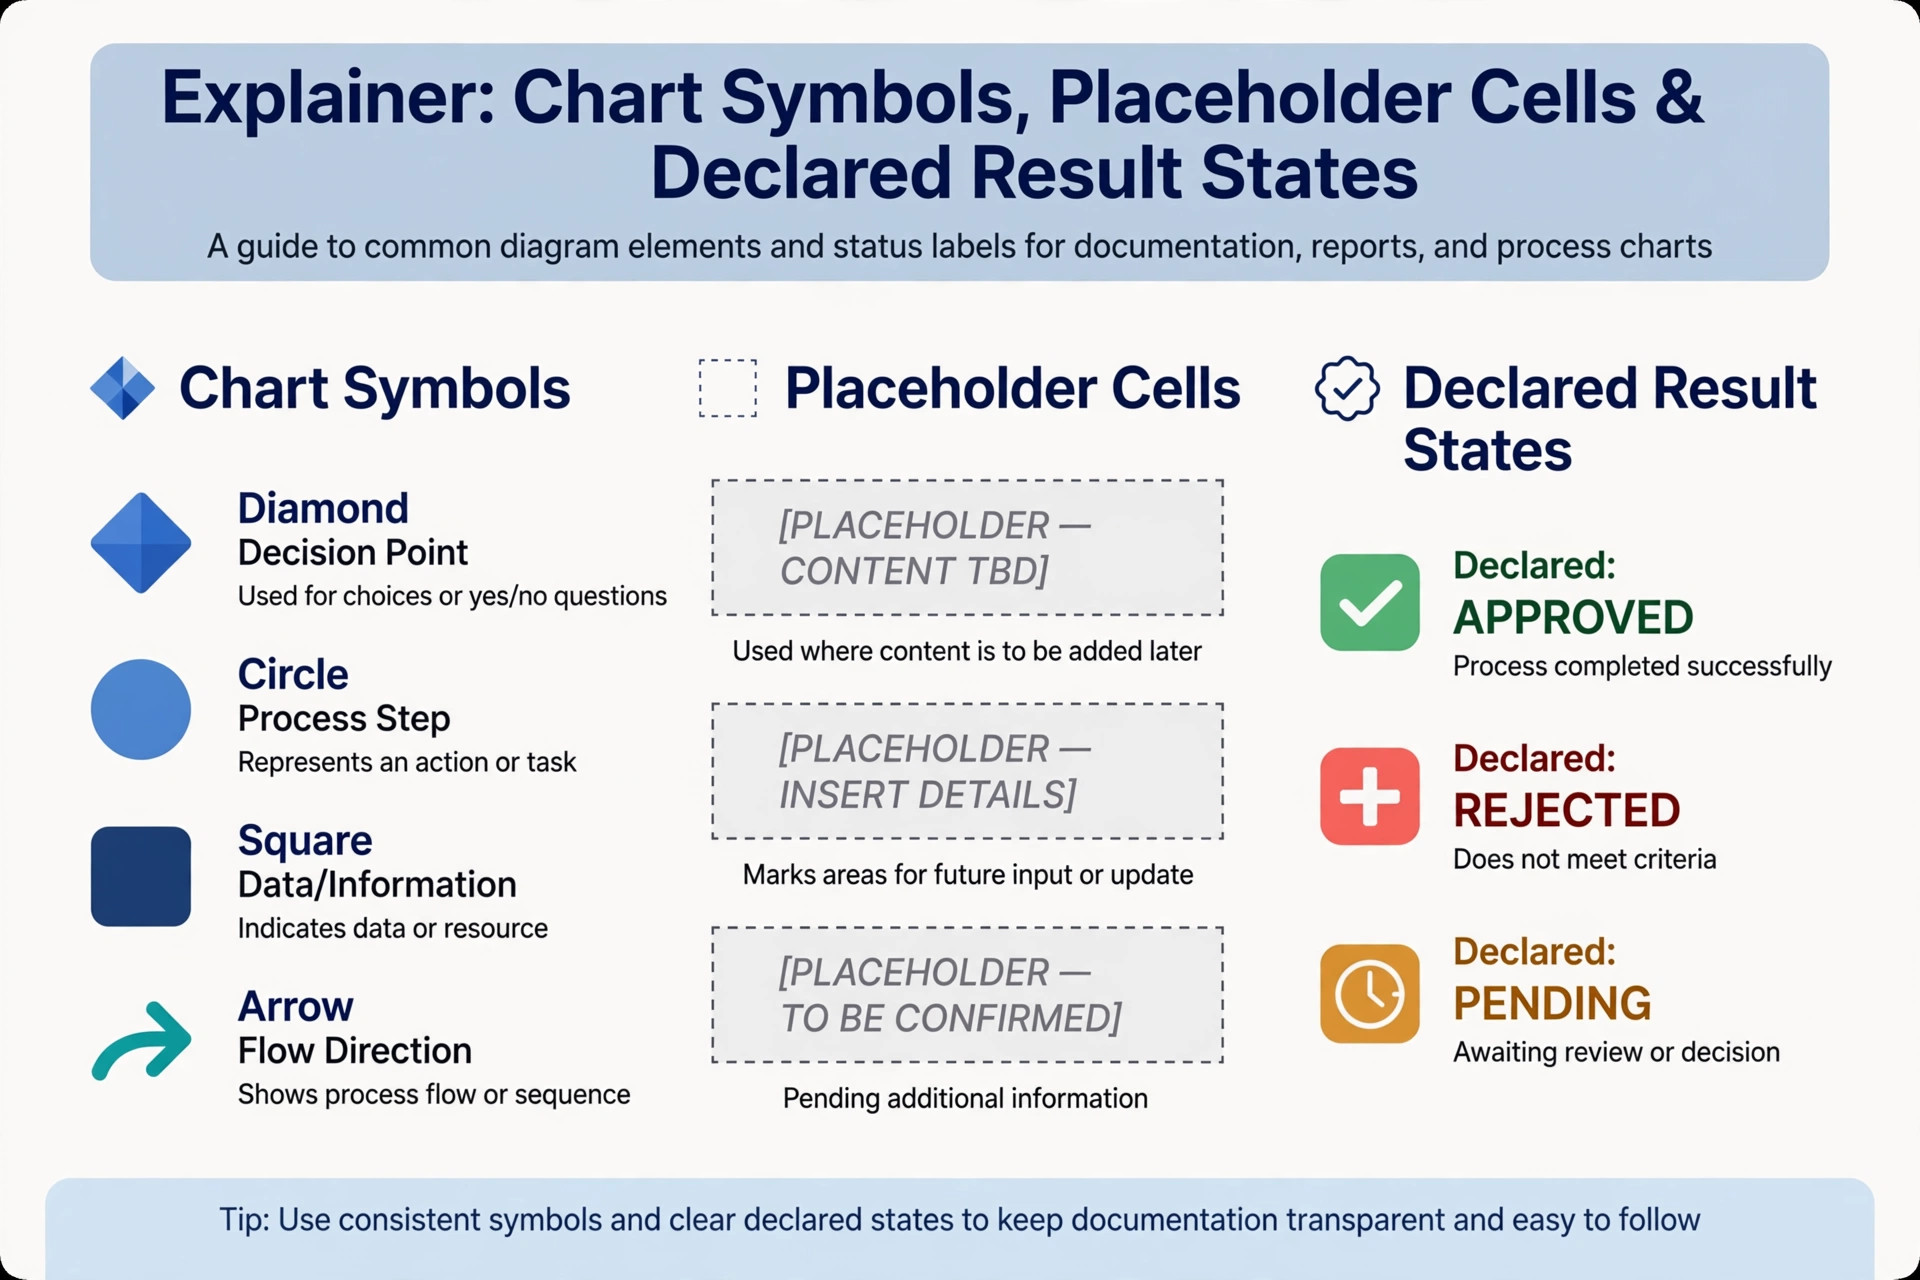
Symbols and labels used on charts
Different publishers use slightly different labels, but the vocabulary is small. FR and SR are nearly universal for the two rounds. Morning charts may use MFR and MSR or simply a separate table titled morning session. Night session charts follow the same idea. You may also see the word declared or updated near the top of a chart, often with a date and time stamp telling you when the chart was last refreshed. That stamp is worth checking, because a chart that was last updated days ago may be missing recent results. A trustworthy chart always shows its update time clearly.
Morning and night session charts
Besides the main afternoon game, several markets run extra sessions. Morning teer charts cover the early sessions for markets like Shillong morning, Juwai morning and Khanapara morning, each with their own FR and SR columns. Night teer charts cover the evening sessions in the same way. These session charts look identical in structure to the main chart, only the session name and the timing differ. If a site shows multiple charts, make sure you are reading the one for the session you actually care about before you draw any conclusions from the record.
How to Read a Monthly Teer Result Record
A monthly teer result record is the heart of the chart system, and reading one well is mostly a matter of knowing where to look. Start at the top of the table and confirm the month and year in the heading, because opening the wrong month is a surprisingly common error, especially when search results mix months together. Then find the column headers so you know which round each number belongs to. Finally, scan down the date column to the day you want. That three step habit (month, columns, date) will keep you accurate every time.

Finding the right month and year
Chart pages are often named by month, and search engines sometimes show you March when you wanted May. Before reading any numbers, look at the chart title or heading and confirm it says the month and year you need, such as May 2026. If the page does not clearly label the month, treat it with caution. Well maintained charts label every monthly table, and that label is part of what makes a chart reliable as a record.
Comparing days across a month
One reason people love monthly records is the ability to compare. You might want to check whether a particular date’s result matches the number on your ticket, or you might be reviewing how consistently a market declared results through the month. To compare, keep your finger or cursor on the date column and slide across the row to read both rounds. Because every row uses the same order, your eyes quickly learn the rhythm, and scanning a full month takes less than a minute once you are used to it.
Why months are the standard record unit
Months won the format war for practical reasons. A week is too short to be useful as an archive, and a full year on one page is too long to scan comfortably. A month fits neatly on a screen or a printed page, matches how people think about time, and lines up with calendar months everyone already knows. That is why nearly every teer chart publisher organizes the teer result record by month, and why learning the monthly layout once serves you for every market and every year.
Shillong Teer Chart, Juwai Teer Chart and Khanapara Teer Chart
The three best known markets each have their own chart, and while the layout logic is the same, the details differ in ways that matter. A Shillong teer chart records the main Shillong game with its afternoon FR and SR, plus separate charts for Shillong morning and Shillong night sessions. The Juwai teer chart covers the Juwai market’s rounds, and the Khanapara teer chart covers the Khanapara market in Assam, which runs its own schedule. Reading the wrong market’s chart is like reading another city’s newspaper: the format looks familiar but the numbers belong to a different game.
Shillong teer chart format
The Shillong chart is the most followed of the three. Its main table lists the date with FR and SR columns for the afternoon game. Dedicated Shillong morning and night tables repeat the same pattern for those sessions. Because Shillong draws the biggest audience, its charts are updated most frequently, but that also means there are more copies of it floating around the internet, including outdated or sloppy ones. Always prefer a chart that shows a recent update stamp. You can cross check the current day's Shillong outcomes on our Shillong Teer result page at https://viewteerresult.today/shillong-teer-result/ before consulting the chart record.
Juwai and Khanapara chart formats
Juwai and Khanapara charts mirror the Shillong structure: date rows with FR and SR columns, organized by month. The main difference is the session lineup. Juwai runs morning and day sessions, and Khanapara runs morning and day sessions as well, so their chart pages may show two or three small tables instead of one. Treat each table independently and read only the session you need. Our Juwai Teer result page at https://viewteerresult.today/juwai-teer-result/ and our Khanapara Teer result page at https://viewteerresult.today/khanapara-teer-result/ carry the current day's numbers for those markets, which you can then verify against the chart records.
Morning teer chart variations
Morning charts deserve a special note because their timing confuses newcomers. Morning sessions are declared earlier in the day than the main afternoon game, and some publishers fold them into the same page as the day chart while others keep them on a separate page. When a page shows more than one table, read the session heading above each table before reading any numbers. A morning FR result and a day FR result are different events, and placing a morning number into a day record (or the reverse) is a classic chart reading error that is easy to avoid once you know to check the heading.

How to Use a Teer Number Chart the Right Way
A teer number chart is a tool for verification and record keeping. Used honestly, it helps you confirm results, organize your own history and understand how the game is structured. Used with false expectations, it leads people into the myth that past results can predict future ones. They cannot. Each round is an independent event, and no arrangement of old numbers changes the odds of the next draw. Keep that firmly in mind and the chart becomes genuinely useful instead of misleading.
Matching your ticket with the record
The most practical use of a chart is verification. If you bought a ticket for a particular date and session, find that date on the chart, check the FR or SR column for your round, and compare the recorded number with your ticket. This is slower but more reliable than relying on memory or on a message forwarded through social media, because the chart gives you the date, session and round in writing. When the numbers match what the official declaration showed, you have a solid basis for any prize claim process. For background on the legal framework of lotteries in the region, the Meghalaya government portal at https://meghalaya.gov.in/ is the authoritative starting point.
Keeping your own results diary
Some followers keep a personal diary alongside published charts, noting the dates they played, the session, and the declared results for their own reference. A chart makes this easy because the monthly grid gives you the full record to copy from. Keep your diary factual: date, market, session, round, declared result. Do not add interpretations, streak notes or theories about future numbers, because those turn a clean record into a misleading one. A diary is for memory, not for forecasting, and the moment it starts suggesting what will happen next, it has stopped being a record.
What charts cannot do
This needs to be said plainly because so much misinformation surrounds it. A chart cannot tell you tomorrow’s number. It cannot reveal a pattern that predicts the next round, because teer results are determined by archery performance, an independent physical event each time, not by a mathematical sequence hidden in old numbers. Any website, video or message that claims a chart reveals “hot” numbers, “due” numbers or guaranteed outcomes is selling a myth. The honest value of a teer result chart 2026 is as a historical record of what was declared, and anyone who tells you otherwise is not describing the chart but exploiting it.
Common Mistakes When Reading Teer Charts
Even experienced readers slip up, so here are the errors worth watching for. First, reading an old month as if it were current. Always confirm the month and year heading before trusting any number. Second, mixing markets: Shillong, Juwai and Khanapara each have separate results, and a number from one market means nothing for another. Third, mixing sessions: morning, day and night are separate events with separate declarations. Fourth, trusting screenshots and forwarded images without checking the source page, because images are easy to edit and often carry no date stamp. Fifth, assuming a blank cell is a zero or a missing result when it may simply mean no game was held that day.
Another subtle mistake is treating an unofficial chart as official. Charts on result websites are compiled records, and while good ones are accurate, the only truly authoritative source is the official declaration at the counter or through licensed channels. Use charts as a convenient reference, and when something important depends on it, such as a prize claim, verify against the official source. Finally, never act on “chart analysis” that promises predictions. If a page pairs its chart with tips, targets or guaranteed numbers, the chart may be fine but the advice is not; read the record and ignore the sales pitch.
Teer Result Chart 2026 FAQs
What is a teer result chart 2026?
It is a month by month record of the teer lottery results declared during 2026. Each monthly table lists calendar dates in rows and the first round (FR) and second round (SR) results in columns, so you can look up any past date’s declared numbers in seconds. Separate charts exist for different markets such as Shillong, Juwai and Khanapara, and for morning and night sessions.
How do I read the FR and SR columns on a teer chart?
Find the date row you need, then read across. The cell under the FR heading shows the first round result declared for that date, and the cell under SR shows the second round result. A dash or blank cell means the result was pending, the game was not held that day, or the chart had not been updated yet. Always confirm the month and year heading first so you are reading the correct table.
Where can I find a monthly teer result record?
Monthly records are published on teer result websites as chart pages, usually organized with one table per month. Look for pages that clearly label the month and year and show an update timestamp. For today's numbers before they enter the chart, check a daily result page first, such as our full teer result list at https://viewteerresult.today/teer-result-list/, and then use the chart to review earlier dates.
What is the difference between a Shillong teer chart and a Juwai teer chart?
They record different markets. A Shillong teer chart lists results declared for the Shillong game, while a Juwai teer chart lists results for the Juwai game. The table layout is the same (dates with FR and SR columns), but the numbers are completely separate because each market holds its own archery rounds. Never use one market’s chart to check a ticket bought for another market.
Do teer charts include morning and night session results?
Many do, but usually in separate tables or on separate pages. Morning teer charts cover the early sessions for markets like Shillong morning, Juwai morning and Khanapara morning, and night charts cover the evening sessions. Each session table keeps the same date plus FR and SR structure. Always read the session heading above the table so you do not mix a morning result with a day result.
Can a teer number chart predict future results?
No. A chart is a historical record of results that have already been declared, and past results do not influence future rounds. Each round is decided by a fresh archery event, independent of everything that came before. Charts are excellent for verification and record keeping, but any claim that chart patterns can forecast winning numbers is a myth, and you should treat sites making such claims with skepticism.
Why are some dates blank on the teer chart?
Blank cells usually mean one of three things: the result had not been declared yet at the time the chart was updated, no game was held on that date (Sundays and holidays are the typical cases), or the chart page itself is out of date. Check the chart’s update timestamp and compare with the calendar. If past working days are blank, find a more recently updated chart rather than guessing what the missing cells mean.
Conclusion
Reading a teer result chart 2026 is a simple skill once you know the layout: confirm the month and year, find your date row, read across the FR and SR columns, and remember what blank cells mean. Keep markets and sessions separate, verify important numbers against official declarations, and use the chart for what it is, a clean historical record, not a prediction tool. A good chart habit saves time, prevents mix ups and keeps your own records honest. One final responsible note: teer is a legal lottery in Meghalaya for adults aged 18 and above only, so participate responsibly and within your means.